How does UNSW's budget stack up compared to other universities?
Maxwell breaks down how UNSW’s budget compares with USyd and UniMelb.
Every student at UNSW pays fees to help keep the university running. But what ‘running’ actually means is often less clear, especially when financial reports are filled with technical terms. This article breaks down where UNSW gets its revenue, how it spends it, and how those figures compare to the University of Sydney (USyd) and the University of Melbourne (UniMelb).
These three Australian universities are roughly equivalent in terms of revenue and reputation, making them ideal for comparison.
Where do major universities get their money from?
Major universities tend to source their income from a range of places, with the main components of revenue including student fees, government funding, contract fees, and investment income. We have set out the exact percentages at UNSW, USyd and UniMelb in the graph below.
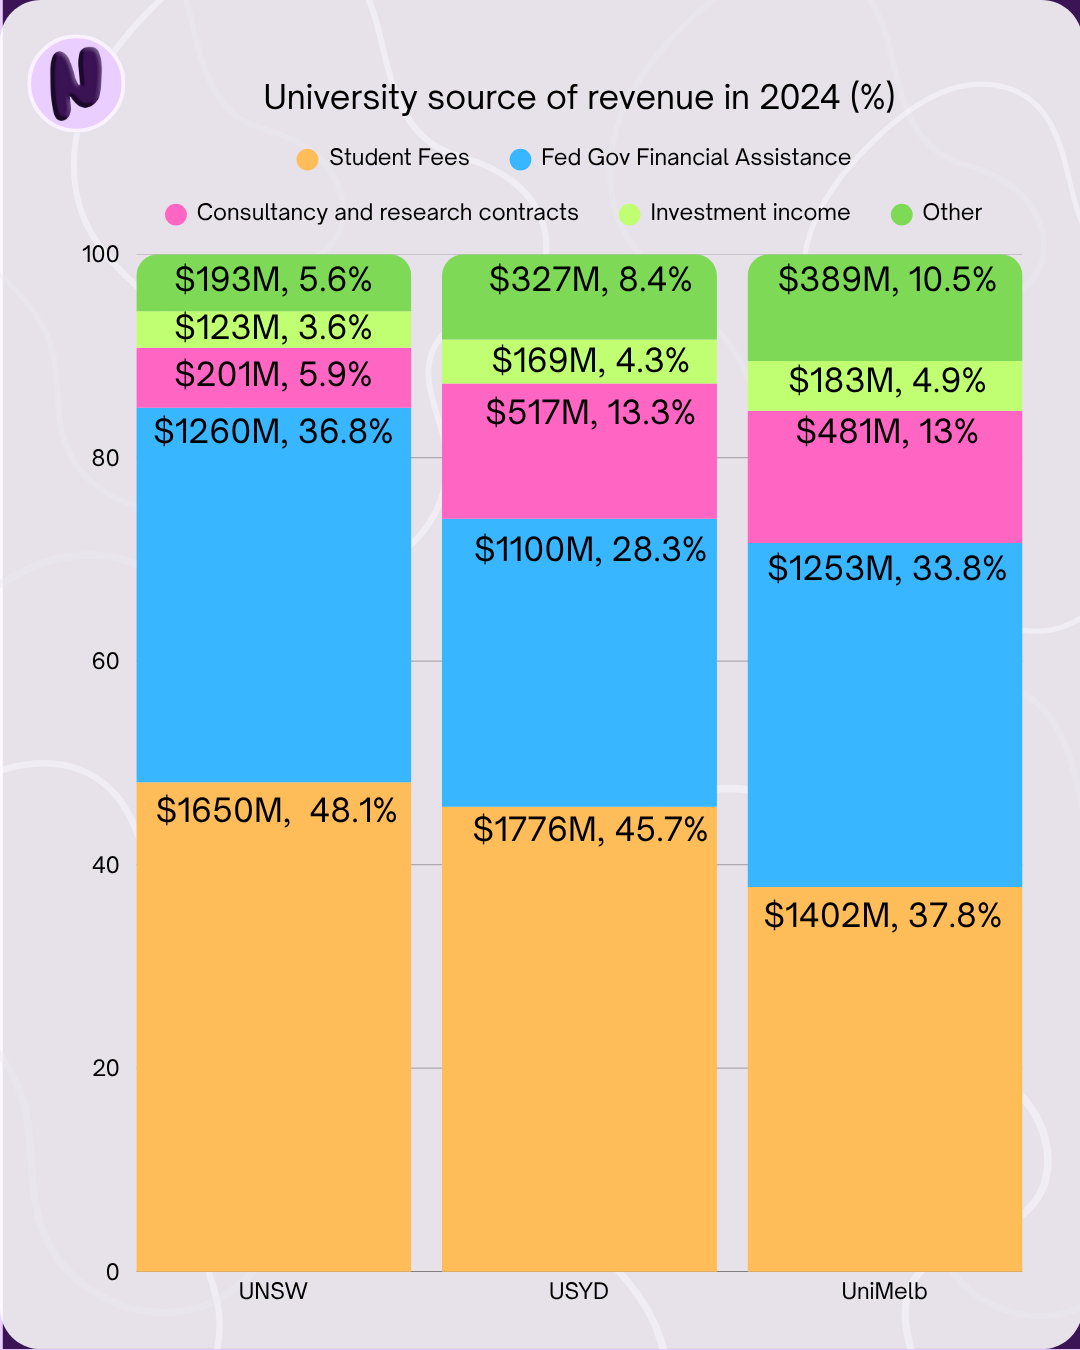
In 2024, UNSW made $3.427B in revenue, while USyd made $3.889B and UniMelb made $3.708B.
All three universities rely heavily on fees and charges, and government funding, but UNSW is the most dependent (48%), compared to USyd (46%) and especially UniMelb (38%).
The universities break down the components of their fees and charges even further.
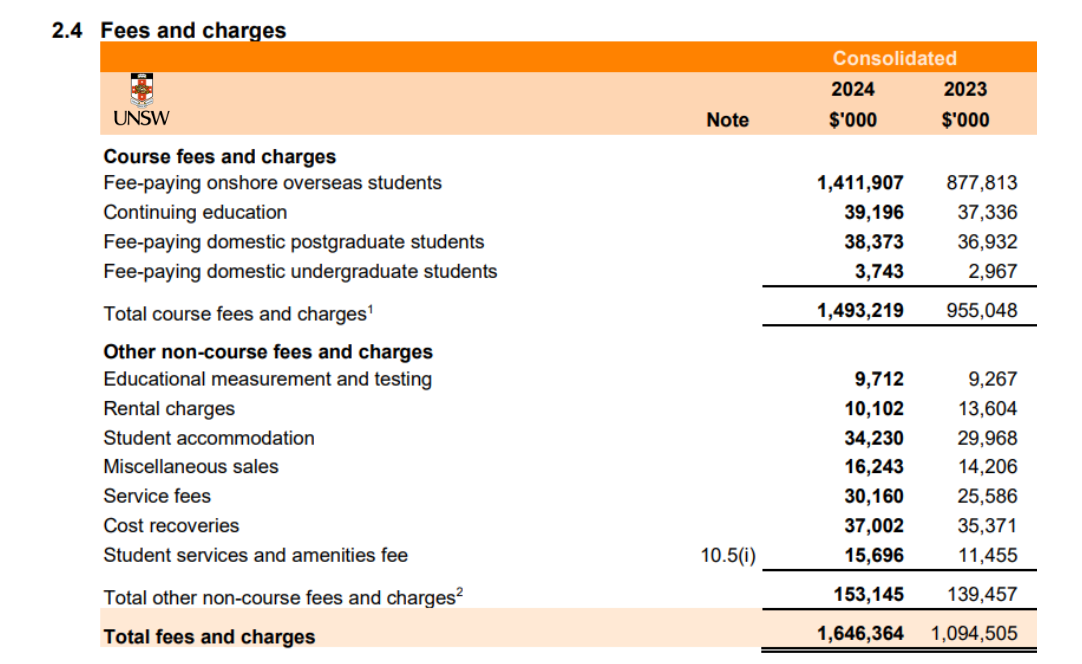
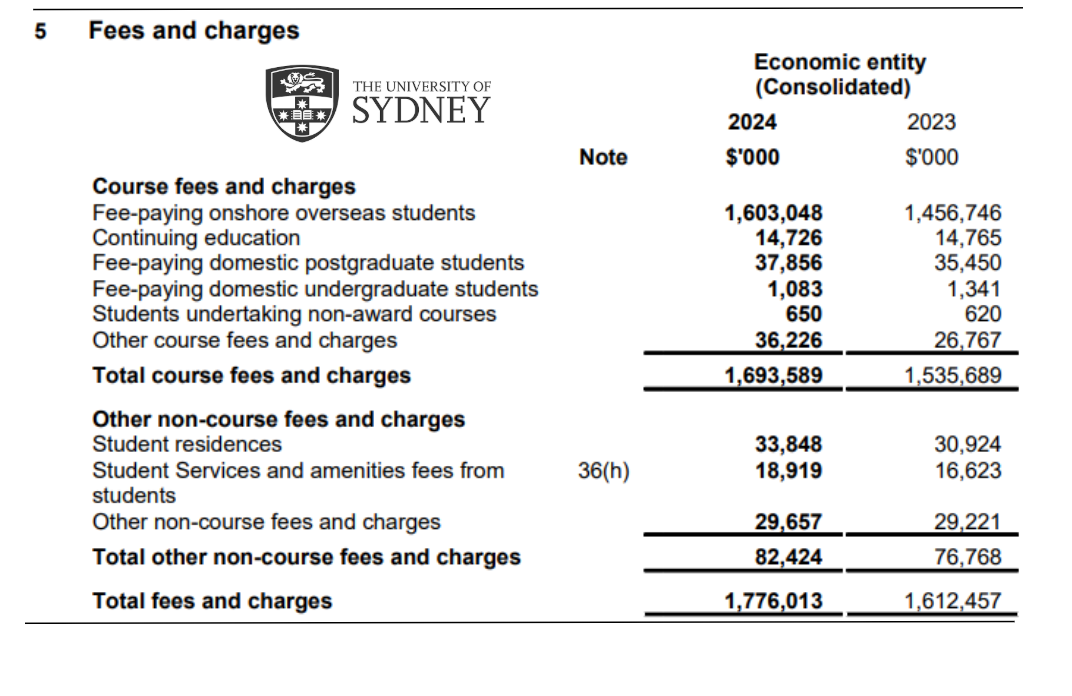
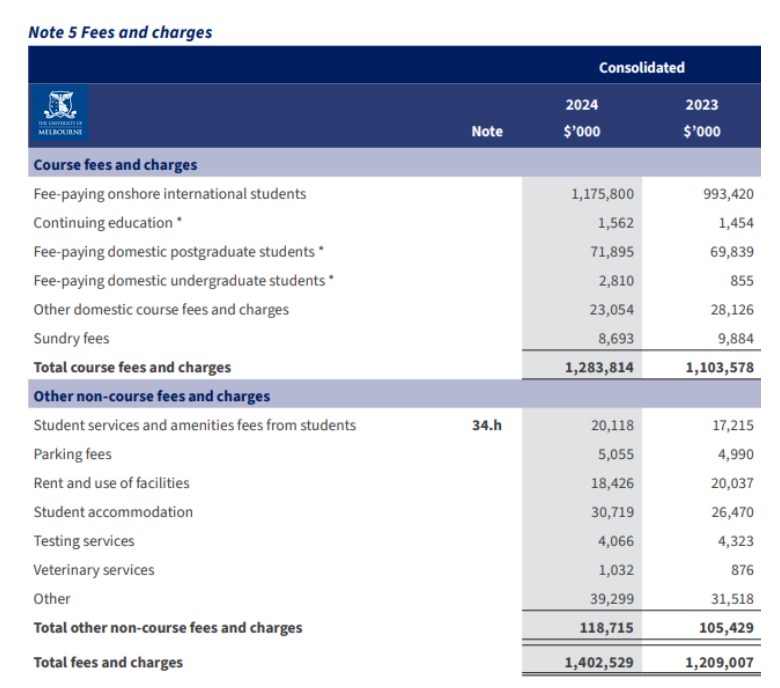
Looking closely at the specific fees and charges, a few key observations emerge.
Reliance on International Students
All universities gain a very significant portion of their fee revenue from onshore international students (90% for USyd, 85% for UNSW and 83% for UniMelb). This highlights the vulnerability of all three universities to policy changes like caps on the number of international students that are permitted to enter Australia.
Comparing Fees and Student Numbers
USyd has higher fees and charges ($1.776B) compared to UNSW ($1.646B), but UNSW makes a higher percentage of its revenue from this source. This is despite the fact that UNSW has more students (82,272), compared to USyd (70,298). UniMelb generated $1.402B while only having an estimated 53,000 students.
Average Fees Per Student
The average fees per student can be found by taking the total fees and charges, then dividing them by the number of students. For UNSW, this is $20011.23, for USyd it's $22937.45, and UniMelb it's about $26462.81 (granted, only estimated student figures for UniMelb have been provided), revealing that UniMelb places the most financial stress on its students comparatively.
Postgraduate and Non-Course Fees
UniMelb has almost twice the amount of domestic postgraduate students' revenue ($71M) compared to UNSW ($38M) and USyd ($37M). UNSW, however, charges the highest amount for non-course fees and charges ($153M) compared to UniMelb ($118M) and especially USyd ($82M)
UNSW also seems to differ significantly in terms of investment income when compared to USyd and UniMelb, earning only $123M from it, compared to USyd ($517M) and UniMelb ($481M).
The universities break down the components of what makes up their investment income, which can be seen below.
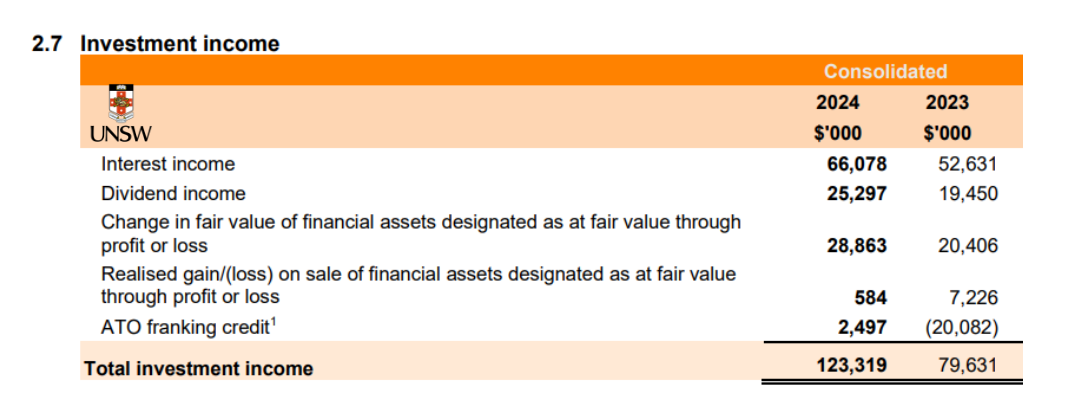
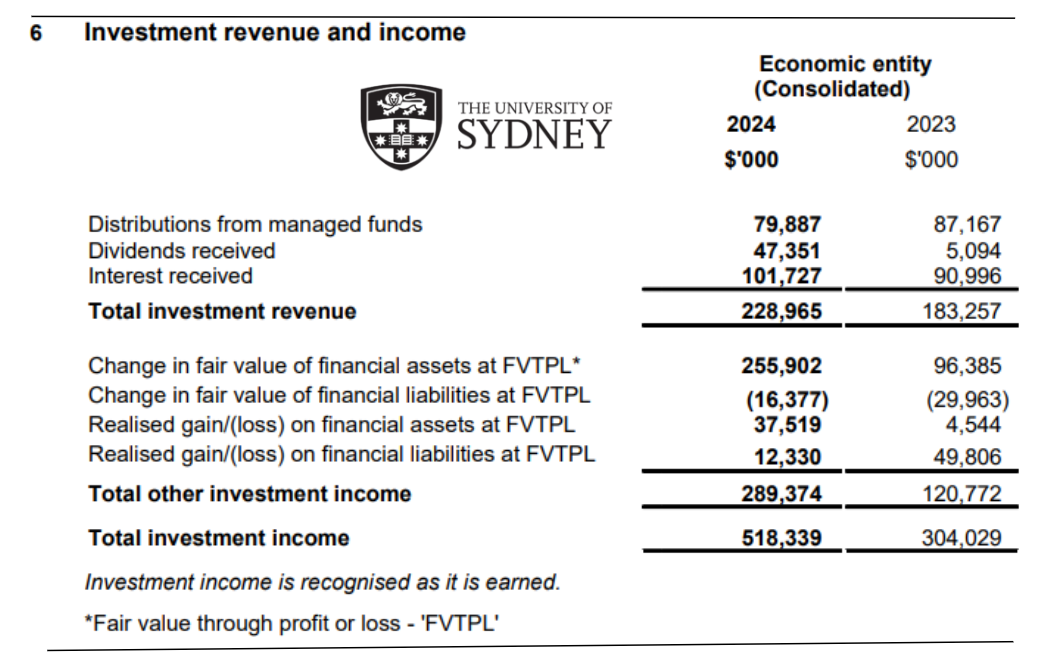
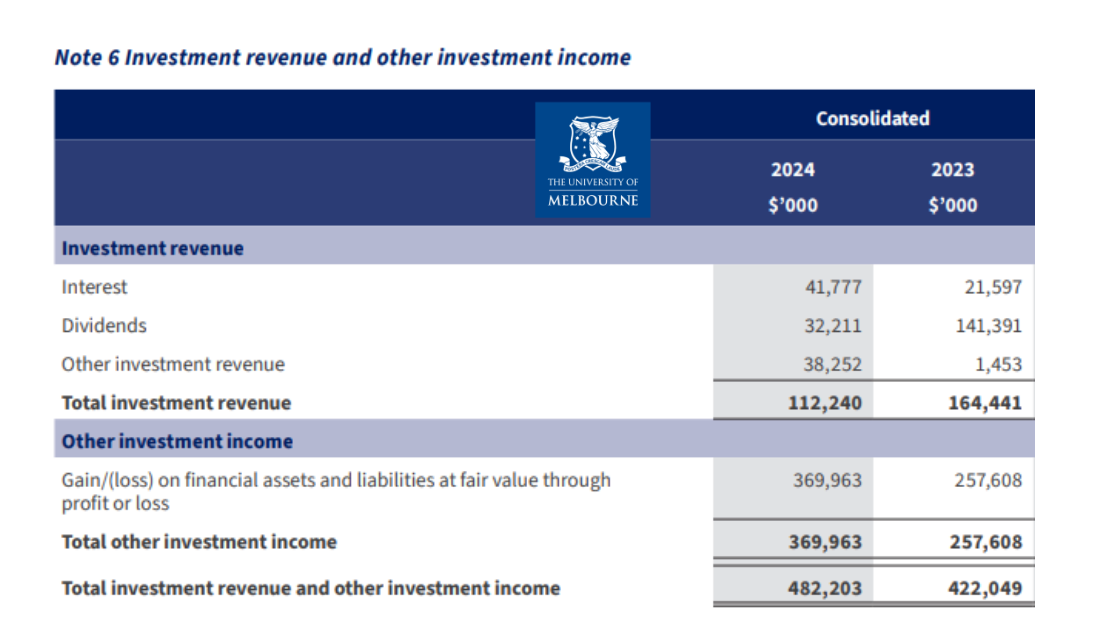
Upon deeper examination, a noticeable portion of investment revenue for USyd and UniMelb came from “Gain/loss on financial assets at fair value through profit or loss” (Fair value is the estimated price reasonable buyers and sellers would agree upon), with $369M for UniMelb and $289M for USyd, compared to only $28M for UNSW. While UNSW has significantly less investment income, it shows they have more financial stability due to less reliance on price fluctuations, as UNSW has more interest income ($66M) than Uni Melb ($41M).
Where do major universities spend their money?
In 2024, UNSW’s total operating expenses (i.e expenses before income tax, as income tax is not required to run the business) were $3.224B, while USyd’s were $3.34B and UniMelb's were $3.491B. The expenses fall into the main categories of employee-related expenses, scholarships, grants and prices, contract services as well as depreciation and amortisation.
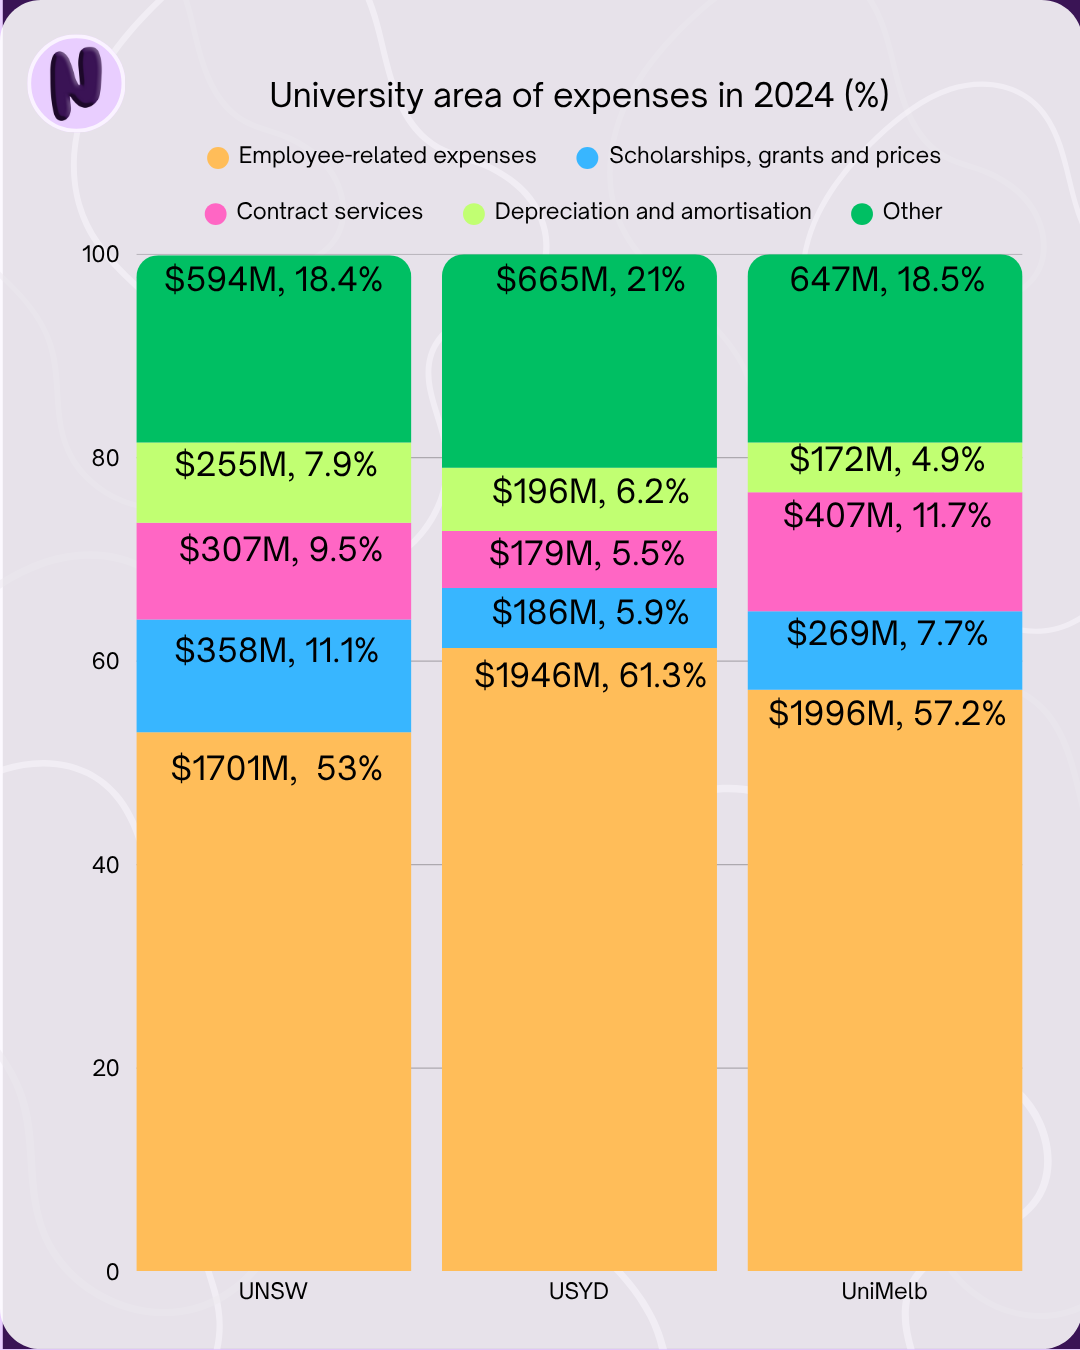
Through this, we can recognise that UNSW dedicates more to scholarships ($358M) compared to USyd ($186M) and UniMelb ($269M), suggesting a potential stronger emphasis on supporting students financially. Furthermore, UniMelb spends significantly more on professional/contracted services ($407M) than UNSW ($307M) and USyd ($179M).
The biggest observation is that all 3 universities spend the most on their employees. The financial reports all have added notes that go into further detail to display the different areas of employee spending. These can be seen in the following tables:
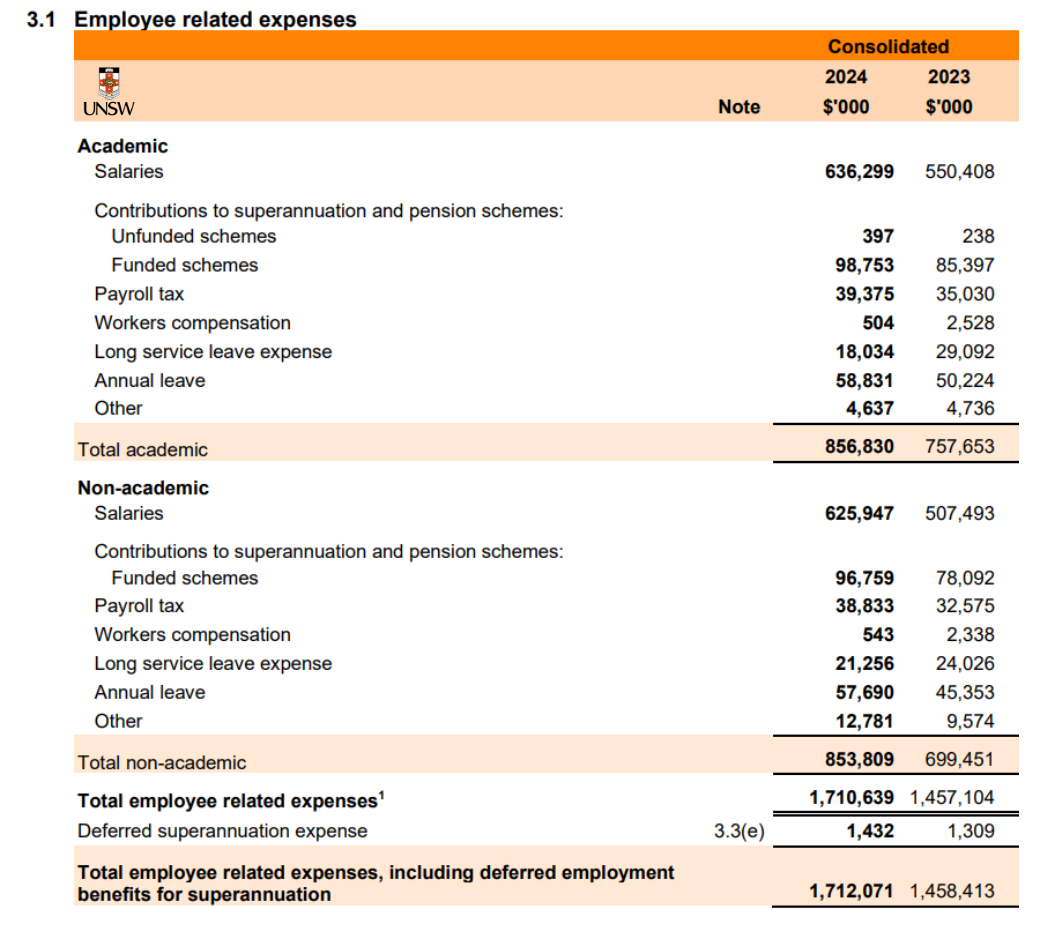
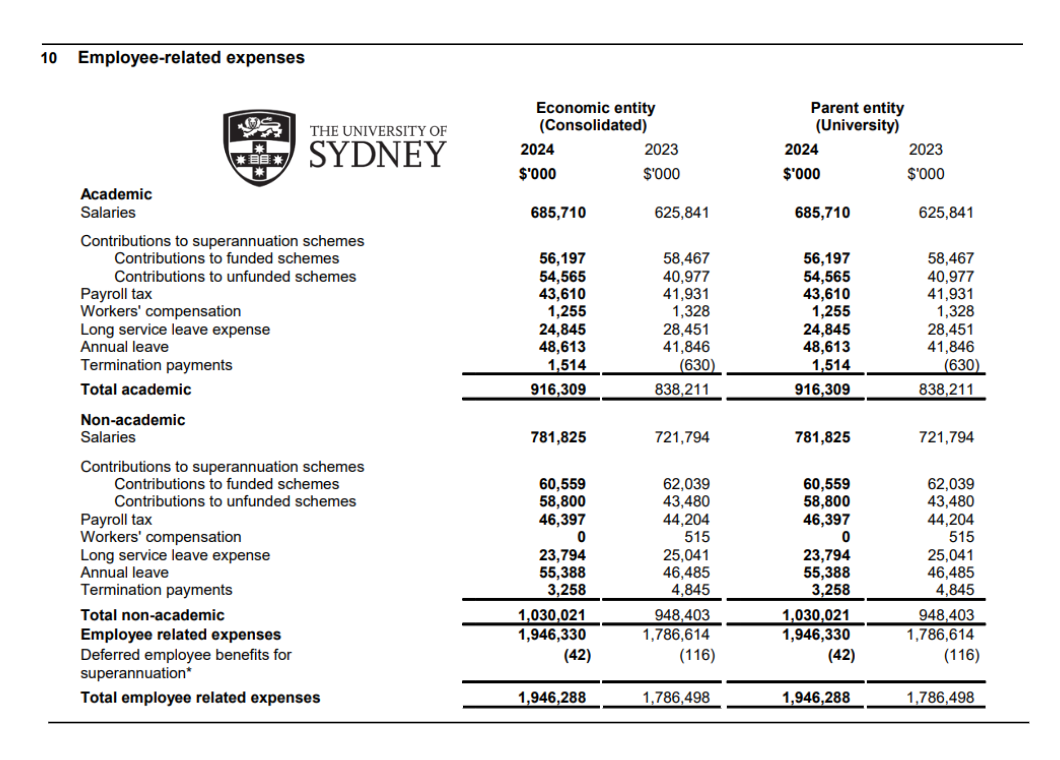
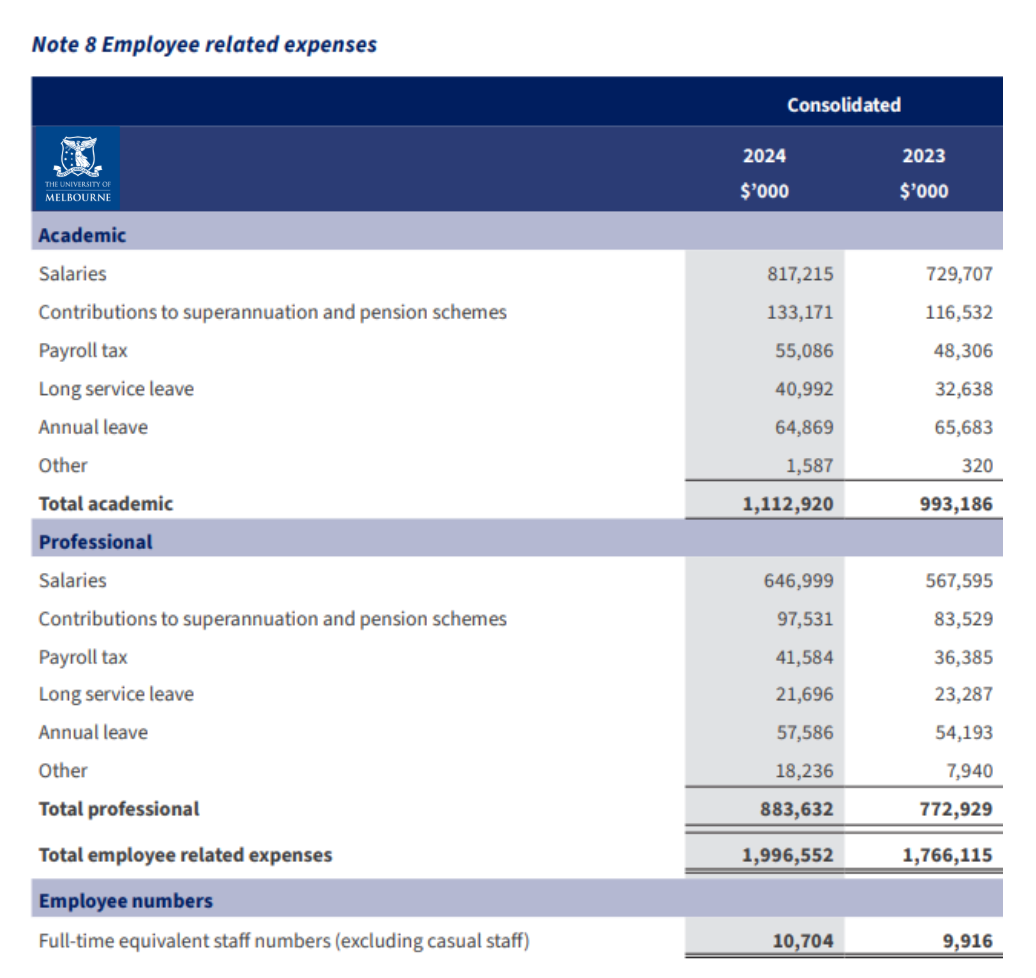
Looking deeper at employee-related expenses, the following observations can be made:
Employee Expenses Across Universities
UNSW spends the least overall on employee expenses, despite having a larger student population, potentially suggesting that the other universities have higher per-staff costs or that UNSW has fewer staff per student with larger class sizes.
Staffing Levels and Workforce Size
UniMelb hires around 5000+ more employees (13758 total on page 64), compared to both UNSW (8318 on page 82) and USyd (9941 on page 43), including casual staff.
Academic vs Non-Academic Pay Structures
UniMelb pays the highest amount of salaries for academics ($817M), while USyd pays the most on non-academic salaries ($781M).
UNSW, USyd, and the UniMelb may share similar revenue sources and cost structures, but their spending patterns reveal distinct approaches to teaching, research, staffing, and investment. Understanding these differences can provide students with a clearer picture of where their fees and donations go and how each institution positions itself in Australia’s higher education landscape.
If you would like to find out further information about UNSW’s finances and financial decisions, here are resources:
- UNSW newsroom for past and future annual reports, which contains more than just financial information (e.g. statements from the Vice Chancellor and overall stats on uni life).
- The UNSW finance hub has a bunch of information meant for staff but accessible to anyone with a ZID email. For example, they have the “management reporting guide 2025” which “provides an overview of UNSW management reporting and financial planning processes and governance framework.”.
- Workplace gender equality agency (WGEA) contains information on all companies' commitment to reducing the gender pay gap, which includes universities like UNSW.
- UNSW Founders has a page that lists all the startups UNSW has founded or invested in, and the different industries they are in.
- Our pays & conditions: This web page lists the wages and salaries for casual, academic and professional staff.
An Excel document by the Department of Education titled “Higher education expenditure on R&D by higher education provider”, which shows figures for a bunch of universities (including UNSW) on how much they’ve spent on r&d and in what specific fields.